How to create a Pie Chart in Access
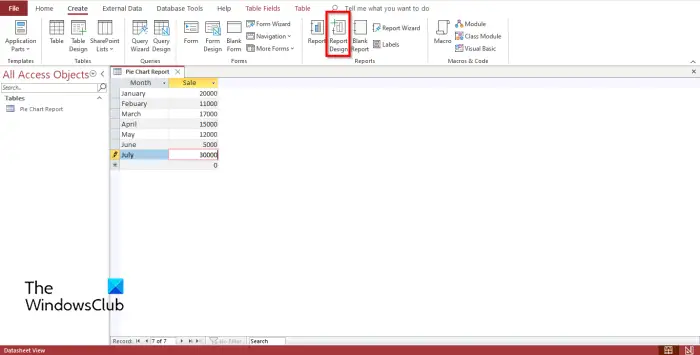
Follow the steps below to create a Pie Chart in Microsoft Access Report Design: Launch Microsoft Access. Enter data or use existing data.
Click the Create tab and click the Report Design button in the Report group. It will open on the Report Design pane.
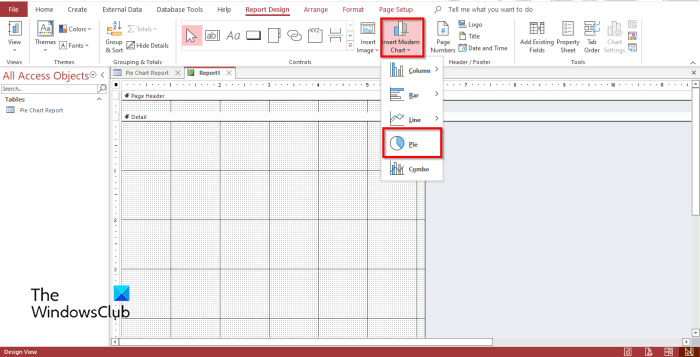
Click the Insert Modern Chart button in the Controls group. Select Pie Chart from the menu. Now you will see a mini plus sign with a chart. Draw it onto the grid. A Chart Settings pane will appear on the right.
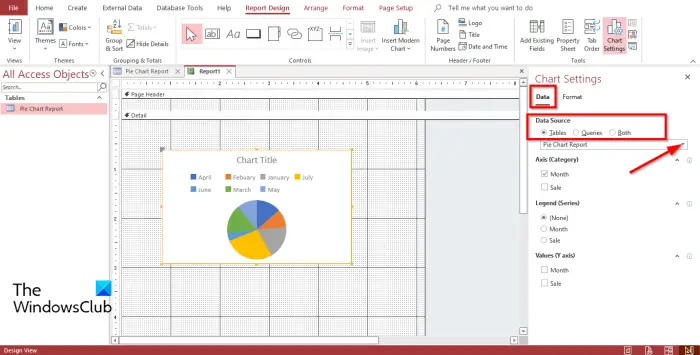
In the Data Source section, you will see options, Tables, Queries, and Both. These options represent where you want the data to come from. In this tutorial, we choose Tables because the data we want to turn into a Pie Chart is in a table. Below are the Axis (Category), Legend (Series), and Values (Y axis). We do not want any more changes to the chart, so we leave these sections alone.
Now click the Format tab. In the Format Data Series section, you can display the data labels by clicking the Display Data Labels checkbox. Now you will see the data labels on the chart. If you want to add a chart title name to your Pie Chart, double-click the chart, and a Property Sheet pane will open.
In the pane, scroll down until you see Chart Title on the opposite side and enter a chart title. If you want to change the color of the Chart Title. On the Property Sheet pane, scroll down until you see the Chart Title Font Color; click the drop-down arrow to select a color or the 3 dots at the end. If you want to hide the Chart Title, click the 3 dots and select the white background color in the Chart Title Font color section. Close the Property pane and the Chart Settings pane.
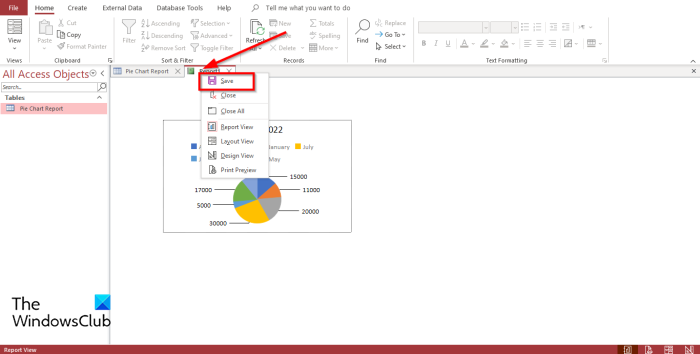
Then click View in the Views group and select Report View to see how the pie chart would look on a report.
To save the report, right-click the report and select Save. A Save As dialog box will open. Name the report and click OK. Now we have a chart in a Report.
Can you create charts in Access?
Yes, you can create Charts in Microsoft Access, like Excel, PowerPoint, Outlook and Word. When it comes to Word, Excel, Outlook and PowerPoint, you can find the charts on the Insert tab, but when it comes to Access, you must create a chart in a Form or Report Design.
How do you create a chart in Access 2007?
Follow the steps below on how to create a chart in Access 2007:
How do you insert a modern chart in Access?
To insert a modern chart in Access, open a Form Design or a Report Design pane and insert the Modern Chart button in the Controls group; you will see various charts in the menu, choose a chart and draw it on the Form Design or Report Design grid. READ: We hope this tutorial helps you understand how to create a Pie Chart in Microsoft Access.